


Analyzing early voting data for the 2026 Primary Election provided by the state of Texas, Unite4Freedom is finding a continuation of what occurred during the early voting for the 2024 GE. Referring to the analysis released in our article on Sunday, 3/1/2026: See Below Previous analysis revealed a pattern of change in the voter participation data that defies logic and is inconsistent with legitimate data maintenance or expected ballot processing methods. In 2024, by the end of Early Voting, on November 2nd, the early voting data contained 8,807,554 records but hidden within those records was evidence of nearly constant, real-time, manipulation of voter participation data. Over 700K voters demonstrate oscillation, where the voter had a record show up, indicating that they had cast a ballot during early voting and then they disappeared and then appeared again and, in some cases, completed the cycle of disappearing and reappearing multiple times. Over a half million ballot records were injected for voters that had already cast their ballot. Many of us heard about voters showing up in 2020 after being a low propensity voter and being told “Our records indicate you have already voted.”
The expectation is that these people had votes parked on their registration because someone identified that they were a low propensity voter, so it seemed safe. Well, those rules have changed. The next generation version of parking votes on a low propensity voter appears to be parking additional votes on a voter that has already cast a ballot. So, what’s the verdict for the 2026 Primary? More of the same… We don’t have final numbers yet – look for our release on Sunday which will reveal the detailed analysis. What we can share so far is that the data is demonstrating the same evidence of real-time vote tampering. One new insight we have during the 2026 Primary will answer one of the lingering questions we hear every time we talk about election validity – Who cheats more, the ‘right’ or the ‘left’? Neither side of the aisle claims the title as ‘supreme cheat’ – give me a minute and I’ll share why we think that is, at the end of this post. Take a look at these two line graphs: There are two important details we can observe here. First, let’s explain what we are looking at. Each of these line graphs represents only the total vote count for one day of early voting, 2/17/2026. Continued below
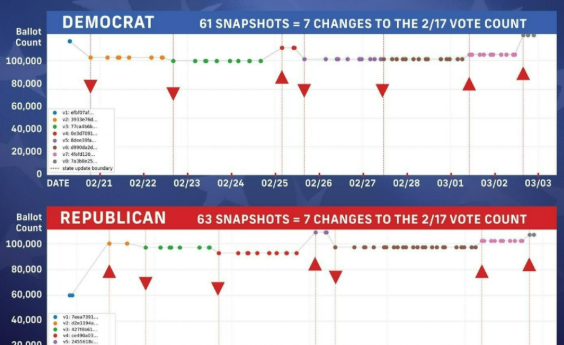
The first data set we have that reflects votes cast on 2/17/2026 for each party is about 2/19 or 2/20. One might think that the state would know by 2/19 or 2/20, who voted on 2/17, but both line graphs show that the total vote count for that day continues to change over time. The vertical lines indicate when the total vote count for votes cast on 2/17/2026 changed, and much more difficult to explain, the arrows indicate the direction of the change. There might be an explanation for a few records – a few ballots – to be added later than the rest for any given day. Maybe adjudication, or resolving provisional ballots, would increase the count slightly over time. That is not what the data shows. What it does show is significant changes in total vote count and it shows the count increasing and decreasing back and forth numerous times. Both the Democrat and Republican ballot count had 7 major changes to the total vote count.
See our Voter Fraud features – The Democrats and Deep State MUST be defeated for America to survive
The Democrat voter data shows the total DECREASES four times during early voting; and the Republican voter data shows the total DECREASES three times during early voting. Both the Democrat and Republican data reflect a swing of about 20,000 ballots which is +/- 20% of the average total. Comparing the two line graphs, you may notice that there are similar changes at the same time during early voting but the changes are not at the same magnitude for each party. It’s hard to understand what is happening here, but it looks like batch processing applying changes to the voter participation data. One thing we do know though, is that the total voter count for this data does change over time. These are the patterns that are revealing themselves as we complete our analysis and peer review. Once we are certain of our findings we will share the full detail. Our current target for that release is Sunday evening, 3/8/2026. Check back for the final report. Coming back to the question… Who cheats more, the ‘right’ or the ‘left’? We can see that the Democrat and the Republican Primary Data reflect similar tampering.
Why? Because this rig is not about the voters, it’s not about parties, it’s about the outcome. It looks like the injected ballots are getting banked for wherever might be needed to steer outcomes later – regardless of party. Considering this, it really appears that this is not executed by people “on the ground” or even County Level actors – this is happening at the State level or above – which is how National Federal Elections are controlled. After all that, the most important point to keep in mind. If this is happening at the state level or higher, we have no way of knowing if this is happening within or from outside of the US. This is a complete loss of control of our election process, and it may be at the hands of a foreign actor. This IS a National Security Emergency. We need Federal Action Now. Previous analysis revealed a pattern of change in the voter participation data that defies logic and is inconsistent with legitimate data maintenance or expected ballot processing methods. In 2024, by the end of Early Voting, on November 2nd, the early voting data contained 8,807,554 records but hidden within those records was evidence of nearly constant, real-time, manipulation of voter participation data. Over 700K voters demonstrate oscillation, where the voter had a record show up, indicating that they had cast a ballot during early voting and then they disappeared and then appeared again and, in some cases, completed the cycle of disappearing and reappearing multiple times.

Over a half million ballot records were injected for voters that had already cast their ballot. Many of us heard about voters showing up in 2020 after being a low propensity voter and being told “Our records indicate you have already voted.” The expectation is that these people had votes parked on their registration because someone identified that they were a low propensity voter, so it seemed safe. Well, those rules have changed. The next generation version of parking votes on a low propensity voter appears to be parking additional votes on a voter that has already cast a ballot. So, what’s the verdict for the 2026 Primary? More of the same… We don’t have final numbers yet – look for our release on Sunday which will reveal the detailed analysis. What we can share so far is that the data is demonstrating the same evidence of real-time vote tampering. One new insight we have during the 2026 Primary will answer one of the lingering questions we hear every time we talk about election validity – Who cheats more, the ‘right’ or the ‘left’? Neither side of the aisle claims the title as ‘supreme cheat’ – give me a minute and I’ll share why we think that is, at the end of this post.
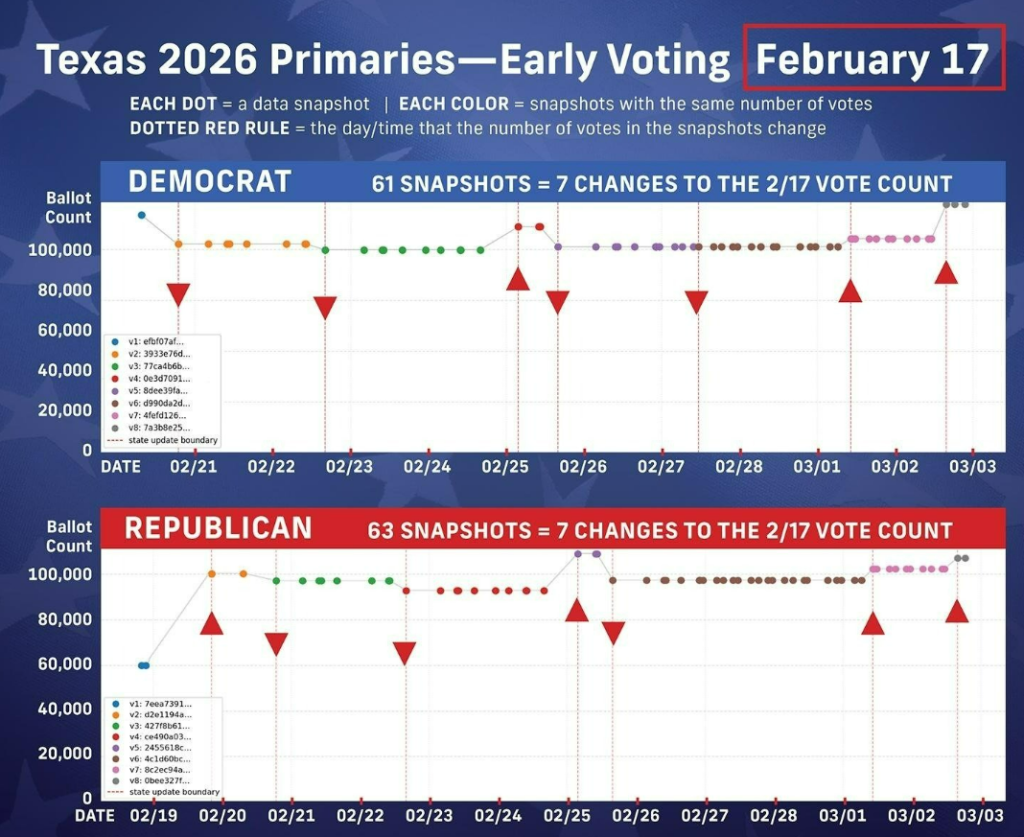
Take a look at these two line graphs below. There are two important details we can observe. First, let’s explain what we are looking at. Each of these line graphs represents only the total vote count for one day of early voting, 2/17/2026. The first data set we have that reflects votes cast on 2/17/2026 for each party is about 2/19 or 2/20. One might think that the state would know by 2/19 or 2/20, who voted on 2/17, but both line graphs show that the total vote count for that day continues to change over time. The vertical lines indicate when the total vote count for votes cast on 2/17/2026 changed, and much more difficult to explain, the arrows indicate the direction of the change. There might be an explanation for a few records – a few ballots – to be added later than the rest for any given day. Maybe adjudication, or resolving provisional ballots, would increase the count slightly over time. That is not what the data shows. What it does show is significant changes in total vote count and it shows the count increasing and decreasing back and forth numerous times. Both the Democrat and Republican ballot count had 7 major changes to the total vote count.
See our Voter Fraud features – The Democrats and Deep State MUST be defeated for America to survive
The Democrat voter data shows the total DECREASES four times during early voting; and the Republican voter data shows the total DECREASES three times during early voting. Both the Democrat and Republican data reflect a swing of about 20,000 ballots which is +/- 20% of the average total. Comparing the two line graphs, you may notice that there are similar changes at the same time during early voting but the changes are not at the same magnitude for each party. It’s hard to understand what is happening here, but it looks like batch processing applying changes to the voter participation data. One thing we do know though, is that the total voter count for this date does change over time. These are the patterns that are revealing themselves as we complete our analysis and peer review. Once we are certain of our findings we will share the full detail. Our current target for that release is Sunday evening, 3/8/2026.
Check back for the final report. Coming back to the question… Who cheats more, the ‘right’ or the ‘left’? We can see that the Democrat and the Republican Primary Data reflect similar tampering. Why? Because this rig is not about the voters, it’s not about parties, it’s about the outcome. It looks like the injected ballots are getting banked for wherever might be needed to steer outcomes later – regardless of party. Considering this, it really appears that this is not executed by people “on the ground” or even County Level actors – this is happening at the State level or above – which is how National Federal Elections are controlled. After all that, the most important point to keep in mind. If this is happening at the state level or higher, we have no way of knowing if this is happening within or from outside of the US. This is a complete loss of control of our election process, and it may be at the hands of a foreign actor. This IS a National Security Emergency. We need Federal Action Now
There are 254 counties in Texas and over 3,140 Counties across the US, County-level reviews can explain what happened locally which is good for insight, but they won’t solve a national problem. Once our state-level analysis is complete we will look for outlier counties and share our findings. Unite4Freedom’s analysis across 35 states indicates systemic issues affecting federal elections—where voters choose statewide offices, the U.S. House, and the U.S. Senate. At this stage, examining one county at a time won’t safeguard national elections or do much to protect November. All Americans deserve a national solution—not a county-by-county exercise. Our focus must be on structural election validity nationwide.