



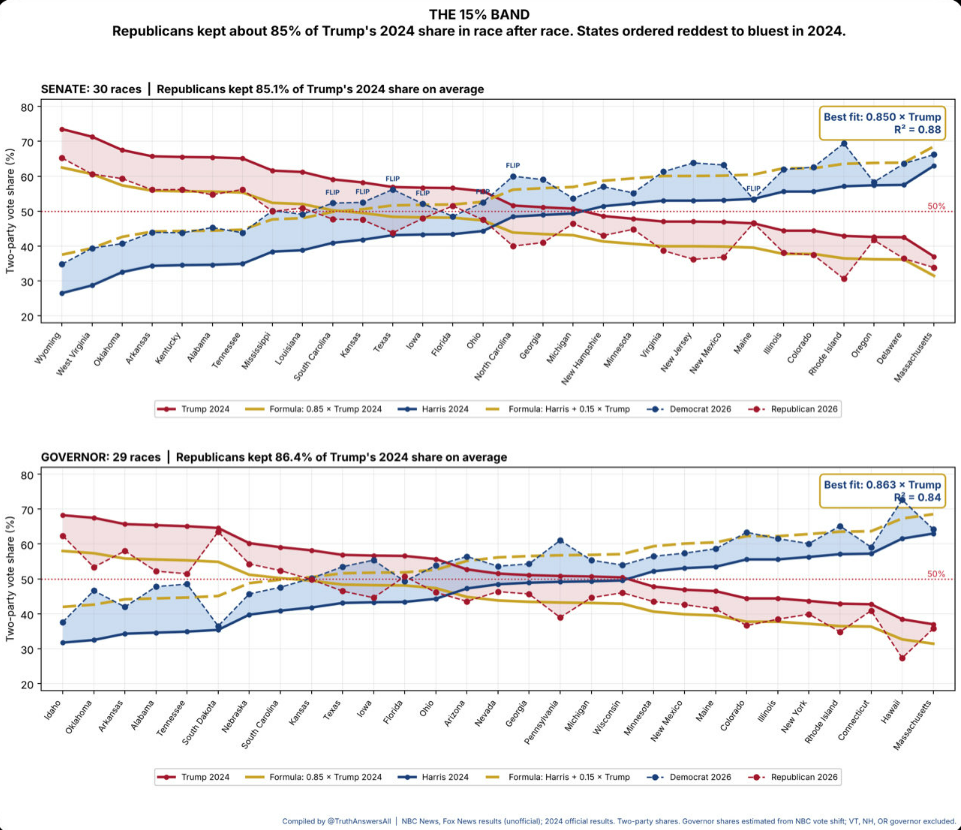
THE 15% BAND Look at this chart. 59 races. Senate and governor. States ordered from reddest to bluest in 2024. The solid lines are 2024. The dashed lines are 2026. The shaded bands are what moved. One formula fits all of it: Republican 2026 = 0.85 × Trump 2024 Democrat 2026 = Harris 2024 + 0.15 × Trump 2024 For every 1,000 Trump points, 850 stayed Republican. 150 landed on the Democratic side. The numbers: Senate: Republicans kept ~85% of Trump’s share Governor: ~86% Variation explained: 88% What makes it strange: It didn’t matter how red the state was. Wyoming, Ohio, Illinois, Massachusetts: same 15% (p = 0.69). The Democratic gain was sized by Trump’s vote, not Harris’s. The Harris part is zero. The 0.85 beat both standard election-swing models in every set of races. Drop any single state and the multiplier stays between 0.846 and 0.853. Why seats flipped: At 0.85, any state where Trump got under about 58.5% falls below 50%. Texas, Kansas, Iowa, Ohio, South Carolina, North Carolina: all under that line. All flipped. What this means: Midterms are messy. This one isn’t. Two sets of races, different candidates, different campaigns, and the same 15% decrease almost everywhere. A pattern this even demands answers at the ballot level: paper ballot hand counts, poll-book check-ins against votes counted, and voter files showing who actually turned out. The numbers raise the question. The ballots can answer it.
THE 15% BAND
Look at this chart.
59 races. Senate and governor.
States ordered from reddest to bluest in 2024.The solid lines are 2024.
The dashed lines are 2026.
The shaded bands are what moved.One formula fits all of it:
Republican 2026 = 0.85 × Trump 2024
Democrat 2026 = Harris 2024 + 0.15 × Trump 2024For every 1,000 Trump points, 850 stayed Republican. 150 landed on the Democratic side.
The numbers:
Senate: Republicans kept ~85% of Trump’s share
Governor: ~86%Variation explained: 88%
What makes it strange:
It didn’t matter how red the state was. Wyoming, Ohio, Illinois, Massachusetts: same 15% (p = 0.69). The Democratic gain was sized by Trump’s vote, not Harris’s. The Harris part is zero.The 0.85 beat both standard election-swing models in every set of races.
Drop any single state and the multiplier stays between 0.846 and 0.853.Why seats flipped:
At 0.85, any state where Trump got under about 58.5% falls below 50%. Texas, Kansas, Iowa, Ohio, South Carolina, North Carolina: all under that line. All flipped.What this means:
Midterms are messy. This one isn’t. Two sets of races, different candidates, different campaigns, and the same 15% decrease almost everywhere.A pattern this even demands answers at the ballot level: paper ballot hand counts, poll-book check-ins against votes counted, and voter files showing who actually turned out.
The numbers raise the question.
The ballots can answer it.— Truth Is Freedom (@TruthAnswersAll) November 6, 2026
We had Grok do an analysis of this theory.
The arithmetic pattern roughly fits the 2026 results as a descriptive model, but it does not hold as evidence of a fixed “85/15 vote-switching algorithm.”
The post’s core claim is that Republican 2026 shares ≈ 0.85 × Trump’s 2024 share (and Democrats ≈ Harris 2024 + 0.15 × Trump 2024) across dozens of Senate and governor races, implying a systematic 15% switch of Trump votes (especially early votes). It cites stability of the multiplier (~0.85), ~88% of variation explained, and flips in states where Trump was under ~58.5%.
How the math checks out
Using certified 2024 presidential shares and 2026 results (mostly Senate, some governor):
| State | Trump 2024 | Pred. R (0.85×) | Actual R 2026 | Pred. D | Actual D 2026 |
|---|---|---|---|---|---|
| Texas | ~56% | ~47.6 | ~43% | ~50.9 | ~55% |
| Ohio | ~55.1% | ~46.8 | ~45% | ~52.2 | ~50% (Sen) / 52% (Gov) |
| Iowa | ~55.7% | ~47.3 | ~46% | ~50.9 | ~50% (Sen) |
| Kansas | ~57.2% | ~48.6 | ~46% | ~49.6 | ~51% |
| South Carolina | ~58% | ~49.3 | ~47% | ~48.7 | ~51% |
| North Carolina | ~50.9% | ~43.3 | ~39% | ~55.2 | ~59% |
| Wyoming | ~71.6% | ~60.9 | ~65% | ~36.5 | ~35% |
| Massachusetts | ~36% | ~30.6 | ~32% | ~66.6 | ~63% |
- Predictions are often within 2–5 points of actual shares.
- A one-parameter multiplier can capture a large, relatively uniform Democratic shift.
- Dropping individual states leaves the multiplier in a narrow band, and the model explains a high share of variance—exactly as claimed.
- States where Trump was in the mid-to-high 50s fall near or below 50% for Republicans under this scaling, matching several of the actual flips (Texas, Ohio, Iowa, Kansas, South Carolina, etc.).
The numbers line up reasonably well as a description of the 2026 results.
Why this does not demonstrate a cheating algorithm
A proportional drop of this size is what a large midterm wave against the president’s party commonly produces. Midterms regularly see the incumbent party lose ground (often 5–15 points depending on the national mood). 2026 is widely described as a historic Democratic wave / Republican wipeout: Democrats flipped multiple Senate seats and governorships in red or red-leaning states, with turnout, candidate quality, and backlash against the administration as the standard explanations.
A simple uniform percentage-point swing (roughly 10–13 points toward Democrats) produces nearly identical results across the relevant range of Trump 2024 shares. The 0.85 multiplier is just a convenient linear approximation of that swing; it is not unique evidence of fixed-percentage vote switching. In redder states the absolute Republican drop is larger; in bluer states it is smaller—precisely the pattern a multiplier captures without any need for an algorithm.
Other points:
- Early voting was heavily Democratic in many places in recent cycles; differential turnout or mail/early vs. Election Day patterns routinely create large apparent “shifts” without fraud.
- Independent reporting, machine testing, audits, and prior statistical reviews of similar vote-switching claims have repeatedly found no evidence of systematic machine or algorithmic flips. Isolated touchscreen or user-error reports exist but do not scale to the millions of votes required.
- The model fits midterm results; it does not uniquely predict or require the early-voting “front-load then switch” mechanism asserted in the post.
Bottom line: The 85/15 formula is a decent post-hoc fit to a large, relatively uniform Democratic midterm swing. It does not mathematically require or demonstrate a cheating algorithm that switches 15% of Trump votes. Normal electoral dynamics (wave year, turnout differences, national mood) explain the same pattern. Ballot-level hand counts, poll-book reconciliation, and voter-file audits remain the proper way to investigate any specific irregularities; the aggregate multiplier alone is not that evidence.
Yes Election was stolen – and the Republican states stolen ALL submitted their voters to DHS – and now the crush will come
Deep State Trapped, Without Honest Election We Do Not Have A Country, It Had To Be This Way
-
ALL 21 STATES. ALL 1,799 COUNTIES. EVERY SINGLE ONE SHIFTED BLUE. – Literally IMPOSSIBLE folks.
-
ELECTION FRAUD IN TEXAS – NO ONE CAN DOUBT what this man says – pure logic
Massive voter fraud — see under top clip. This is a growing thread