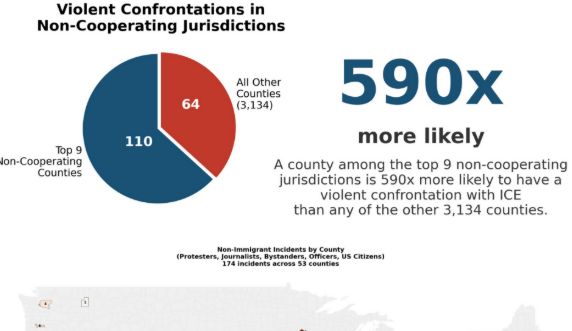


I am horrified. I cannot believe it. I analyzed public databases and media reporting on violent confrontations with ICE over the past year. Just 9 counties accounted for TWO-THIRDS of violent confrontations with ICE in America. This is twice all violent confrontations in the remaining 3,134 counties COMBINED. A violent confrontation in these 9 counties was 590 TIMES more likely than any of these other 3,134 counties. 590 times. I plotted these 9 counties, and I found that all 9 counties are sanctuary jurisdictions run by Democrat politicians that resist immigration law enforcement. These violent confrontations are RARE in states and cities where local officials cooperate with law enforcement. – Kevin Bass
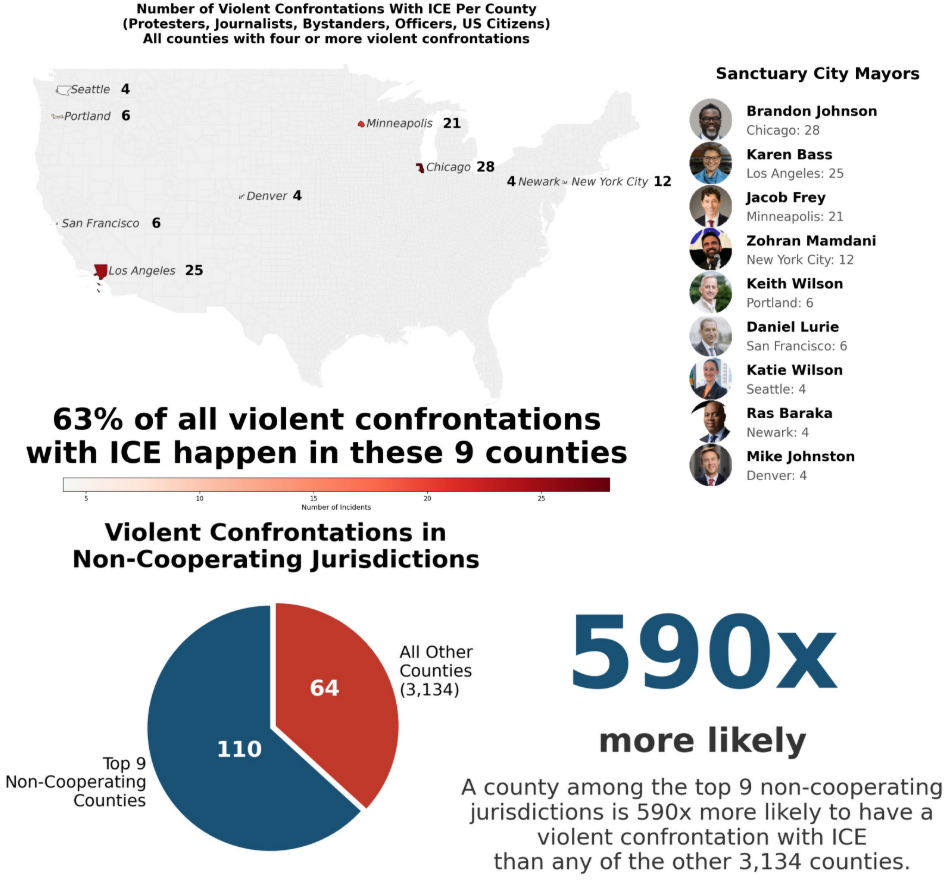
The major cities in these top 9 counties are well-known: Chicago is at the top, with Brandon Johnson as mayor. Then, in order: Los Angeles (Karen Bass) Minneapolis (Jacob Frey) New York City (Zohran Mamdani) Portland (Karen Wilson) Then San Francisco, Seattle, Newark, and Denver.
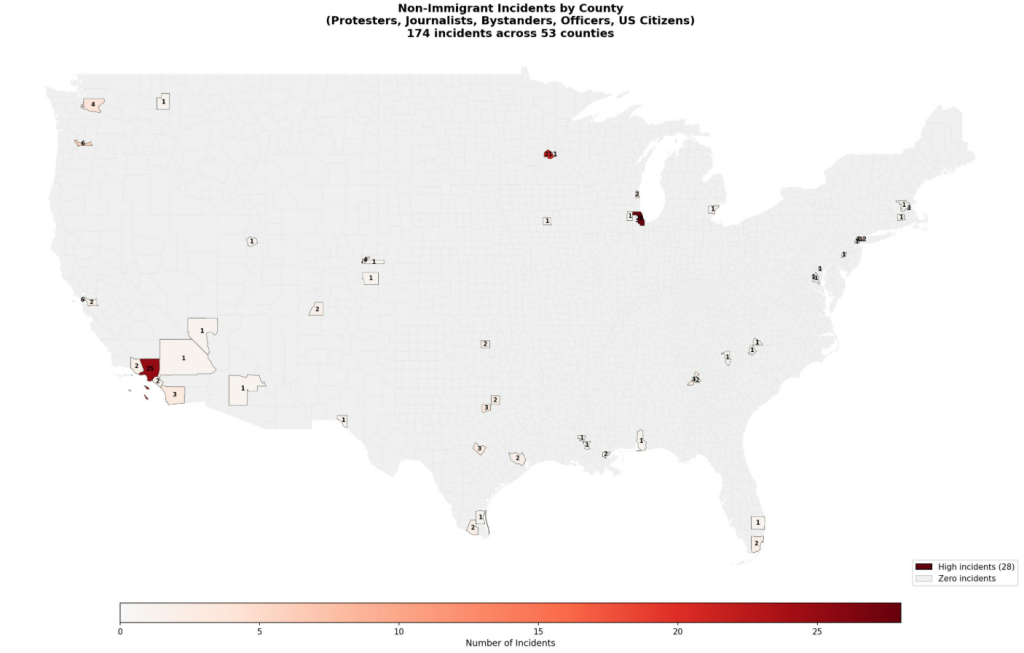
Methodology and detailed findings ICE ENFORCEMENT INCIDENTS ANALYSIS (2025-2026) An analysis of violent confrontations between ICE agents and non-immigrants (protesters, journalists, bystanders, officers, and US citizens) during immigration enforcement operations. KEY FINDING: EXTREME GEOGRAPHIC CONCENTRATION The top 9 counties account for 63% of all violent confrontations with non-immigrants nationwide. A violent confrontation is 590 TIMES MORE LIKELY in the top 9 counties than in any of the other 3,134 US counties. BY THE NUMBERS Total non-immigrant incidents: 174 Incidents in top 9 counties: 110 (63%) Incidents in remaining 3,134 counties: 64 (37%) Counties with 4+ incidents: 9 Per-county likelihood ratio: 590x TOP 9 COUNTIES (4+ incidents each) Rank County City Incidents Mayor —- —— —- ——— —– 1 Cook County, IL Chicago 28 Brandon Johnson 2 Los Angeles Co, CA Los Angeles 25 Karen Bass 3 Hennepin County, MN Minneapolis 21 Jacob Frey 4 New York County, NY New York City 12 Zohran Mamdani 5 Multnomah County, OR Portland 6 Keith Wilson 6 San Francisco Co, CA San Francisco 6 Daniel Lurie 7 King County, WA Seattle 4 Katie Wilson 8 Essex County, NJ Newark 4 Ras Baraka 9 Denver County, CO Denver 4 Mike Johnston All 9 counties are in jurisdictions with sanctuary policies that limit cooperation with federal immigration enforcement.
WHAT COUNTS AS A “VIOLENT CONFRONTATION” This analysis focuses on confrontations involving people who are NOT the targets of immigration enforcement: – Protesters: Individuals at demonstrations against ICE operations – Journalists: Press covering enforcement actions – Bystanders: Uninvolved individuals caught in enforcement operations – US Citizens: American citizens wrongfully detained, assaulted, or deported – Officers: ICE/CBP agents injured in attacks on facilities These are tracked separately from incidents involving detainees or enforcement targets. DATA SOURCES The data comes from multiple sources, organized by reliability: TIER 1 – Official Government Data (49 incidents) Sources: ICE Detainee Death Reporting, DOJ records, court filings TIER 2 – Investigative Journalism (69 incidents) Sources: The Trace, ProPublica, NBC News investigations TIER 3 – Systematic News Search (218 incidents) Sources: AP, Reuters, major outlets via defined search methodology TIER 4 – Ad-Hoc News Reports (64 incidents) Sources: Local news, verified social media reports TOTAL: 400 documented incidents (174 involving non-immigrants) HOW THE DATA WAS COLLECTED Tier 1 (Official Data): –
ICE Detainee Death Reporting website – American Immigration Lawyers Association death tracking – DOJ court records and federal litigation filings – FOIA releases Note: ICE stopped publishing death reports after October 2025 Tier 2 (Investigative Journalism): – The Trace: ICE/CBP shootings tracker – ProPublica: US citizens detained/deported investigation – ProPublica: Less-lethal weapons documentation – ProPublica: Banned chokeholds video evidence – NBC News: ICE shootings compilation – ACLU litigation filings Tier 3 (Systematic News Search): – Defined source list: AP, Reuters, NBC, CBS, ABC, CNN, major regional papers – Search terms: “ICE shooting”, “ICE protest”, “CBP force”, etc. – Date range: January 20, 2025 – January 26, 2026 – Each incident verified against at least one additional source Tier 4 (Ad-Hoc Reports): – Local newspapers – Verified social media posts – Community organization reports – Each record includes source URL for verification SANCTUARY STATUS CLASSIFICATION Primary source: DOJ Sanctuary Jurisdiction List (Executive Order 14287)
Secondary source: ILRC State Map on Immigration Enforcement Categories: – Sanctuary: State/local policy limits cooperation with ICE – Anti-sanctuary: State law requires cooperation with ICE – Neutral: No formal policy either direction – Cooperative: Voluntarily cooperates with ICE detainers KNOWN LIMITATIONS 1. Media coverage bias – Sanctuary jurisdictions may receive more media attention, potentially inflating incident counts in those areas 2. ICE reporting gaps – ICE stopped publishing death reports after October 2025 3. Selection bias – Tier 3-4 data has higher selection bias risk 4. Known undercounts: – ProPublica found 170+ US citizen detentions; ~50 documented here – The Trace identified 26 shootings; 19 with full details here – GAO found ICE couldn’t provide 5 years of use-of-force data DATA COVERAGE Time period: January 20, 2025 – January 26, 2026 Geographic scope: All 50 US states + DC Last updated: January 26, 2026 FOR MORE INFORMATION The full dataset with source URLs for each incident is available in the data files. Each incident record includes the original news source for verification.