


Updated info from Grok
- 2024 rape/sexual assault: ~560,890 victimizations (rate 2.0 per 1,000 persons age 12+), up slightly from 481,020 in 2023. Only ~24% reported to police.
- Overall violent incidents continue to show Black offenders overrepresented relative to population share (~24–28% of incidents vs. ~13% population), while patterns for rape specifically are not isolated in the latest releases.
bjs.ojp.gov
Aggregated Violent Crime Patterns (Including Rape/Sexual Assault)These provide the closest proxy, as rape is one component of violent victimization. Data reflect victim perceptions; unknown offender race is common (~11–19%).2017–2021 aggregate (multi-year to improve sample size):
- White victims (15.8 million violent incidents): ~55% white offenders (intraracial), ~15% Black offenders (interracial), ~10% Hispanic offenders.
- Black victims (3.1 million incidents): ~61% Black offenders (intraracial), ~12% white offenders (interracial).
- Hispanic victims (4.1 million incidents): ~35% Hispanic offenders (intraracial), ~25% white offenders, ~18% Black offenders.
Intraracial violence remains the most common pattern overall, but Black offenders appear in a disproportionate share of incidents against white victims compared to the reverse.2022 single-year example (violent incidents):
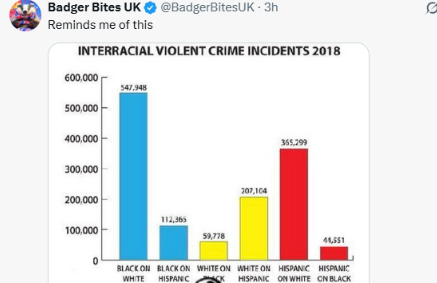
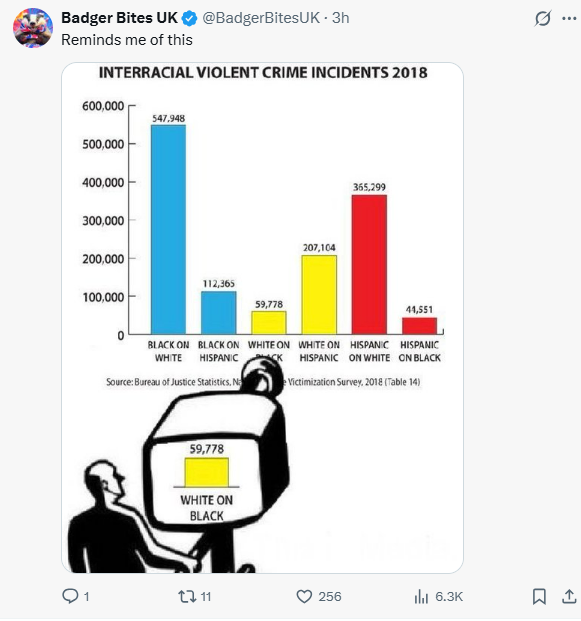
- White victims: Substantial white-on-white (intraracial majority), with notable Black-on-white incidents (~543k estimated).
- Black victims: Strong black-on-black majority, far fewer white-on-black.
- Similar overrepresentation patterns for Black offenders.
2020 percent distributions (violent incidents):
- White victims: 69% same-race (white) offenders.
- Black victims: 66% same-race (black) offenders.
- Hispanic victims: ~41% Hispanic offenders, 33% white, 20% black.
2023 violent incidents (Table 13 cross-tab): White victims had the highest raw numbers with white offenders (~1.95 million); black-on-black also prominent. Black offenders overall ~24% of incidents.
Arrest Data (FBI UCR/NIBRS)FBI arrest statistics (by offender race only, no victim-offender pairing) show Black individuals overrepresented in rape arrests relative to population (~25–27% of rape arrests in available years like 2019, vs. ~13% population). White arrests form the majority in absolute numbers. Homicide data (which sometimes includes rape-related cases) shows similar disparities, but rape itself lacks detailed victim-offender race matrices in recent public releases.
Key Caveats
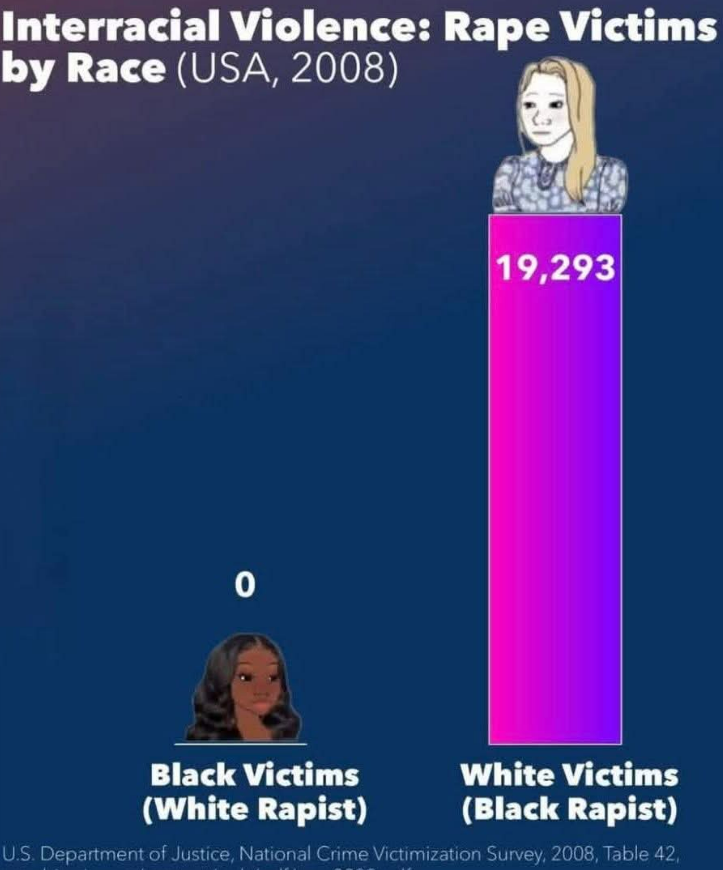
- Small samples and suppression: Rape/sexual assault has lower reporting and smaller NCVS subsamples than other violent crimes, leading to unreliable or suppressed estimates for fine-grained interracial breakdowns (as in the 2008 zero). Multi-year aggregates help but still carry uncertainty.
- Perception-based: Offender race relies on victim reports; unknown/mixed cases are excluded or grouped.
- Trends: Overall violent victimization (including rape) has fluctuated, with some recent upticks in rape rates (e.g., 2024), but Black victimization rates rose notably in 2023 for violent crime including rape/sexual assault.
- No major new detailed interracial rape tables have been released post-~2018 in the standard annual reports. Older patterns (disproportionate Black-on-white relative to white-on-Black) appear consistent in the available aggregates, driven largely by overall violent offending disparities rather than rape alone.
For the absolute latest or more granular data, check the BJS NCVS dashboard (ncvs.bjs.ojp.gov) or full PDF reports, as methodology changes (e.g., 2024 redesign) may affect future comparability. These statistics reflect reported/perceived incidents only; they do not imply causation or apply uniformly to all individuals.